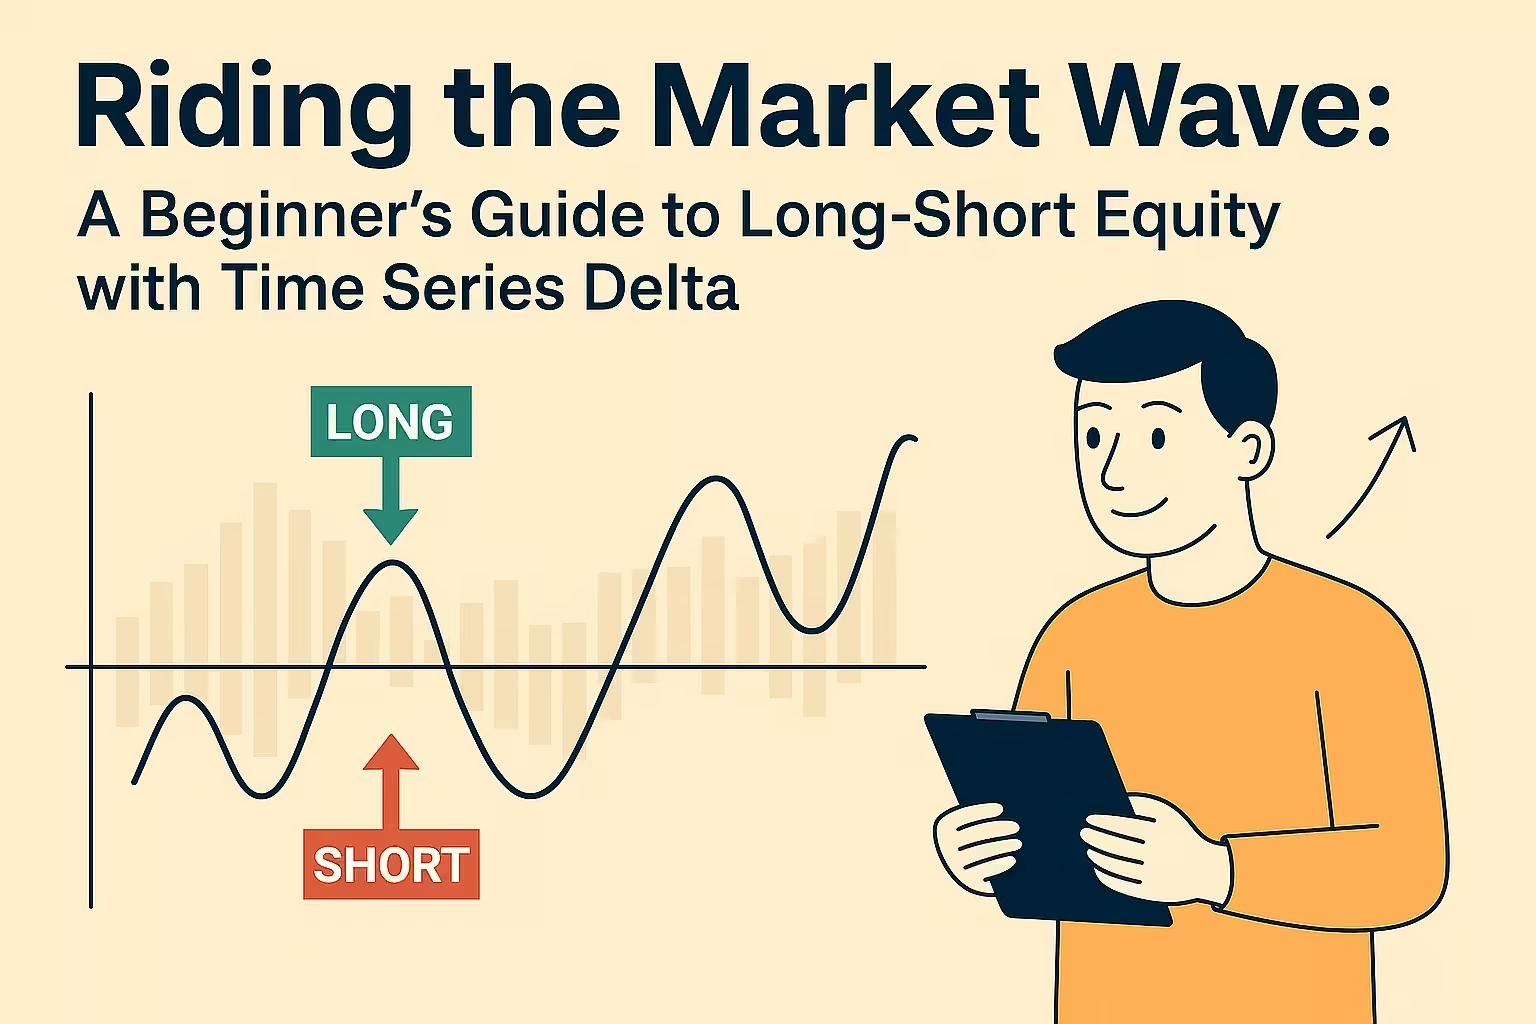
Riding the Market Wave
An interactive guide to long-short equity strategies using the power of momentum.
This app translates a complex trading strategy into an intuitive experience. Explore the core concepts and interact with a simulated backtest to see how it performs.
Explore the Momentum Detector: `ts_delta(x,d)`
The `ts_delta(x,d)` operator works on a **timeseries** of data, like a stock’s daily price (x). It’s a simple formula: Current Price – Past Price over a lookback period (d). Use the controls below to see it in action with real 2024 stock data.
Price data sourced from Yahoo Finance for illustrative purposes.
The Strategy in 3 Simple Steps
This is a systematic process. At regular intervals (e.g., monthly), we re-evaluate the entire market and adjust our portfolio based on these rules.
1. Rank Stocks
Calculate `ts_delta(x,d)` for all 3,000 stocks and rank them from highest to lowest momentum.
2. Go Long (Buy)
Buy a portfolio of the top 10% of stocks — the ones with the strongest upward momentum.
3. Go Short (Sell)
Short-sell the bottom 10% of stocks — the ones with the worst downward momentum.
Interactive Backtest Dashboard
This dashboard simulates the strategy’s performance over 5 years. Adjust the parameters to see how they affect the outcome. A real backtest is computationally heavy; this simulates the results of different pre-calculated scenarios.
Cumulative Return
+125.8%
Sharpe Ratio
0.85
Max Drawdown
-18.2%
Volatility
15.5%
Example Portfolio Snapshot
This is a static example of what the long and short portfolios might look like at a given rebalance date.
📈 Top 10 Long Positions (Buy)
📉 Bottom 10 Short Positions (Sell)
Key Risks & Considerations
Momentum strategies can experience sharp, sudden losses, especially during market turning points. When a bear market ends, the “loser” stocks you are shorting can rebound violently, causing significant drawdowns.
Rebalancing monthly means frequent trading. Brokerage commissions and slippage (the difference between expected and actual execution price) can significantly reduce the strategy’s profitability if not managed carefully.
Choosing the right lookback period (`d`) is a trade-off. A short period (e.g., 20-30 days) is agile but can be tricked by short-term market noise. A long period (e.g., 90-120 days) captures more stable trends but reacts slowly to new information.

Leave a Reply